If you manage multiple branches, you are making decisions every day without complete information. You know what last month’s report said. You know which branch felt off during your last visit. You know what your team told you on this morning’s call.
But you do not know what is actually happening across all your branches right now, or what patterns have been quietly forming for the past six months. That gap is not a management failure. It is a visibility problem.
Operational analytics for branches is the practice of collecting, aggregating, and analyzing data from day-to-day branch operations to surface patterns, measure performance, and support better decisions. The goal is not to generate reports for their own sake. The goal is to replace guesswork with evidence.
Experience tells you what you’ve seen. Data tells you what you haven’t.
At a Glance
- Operational analytics captures data from every service interaction across all your branches
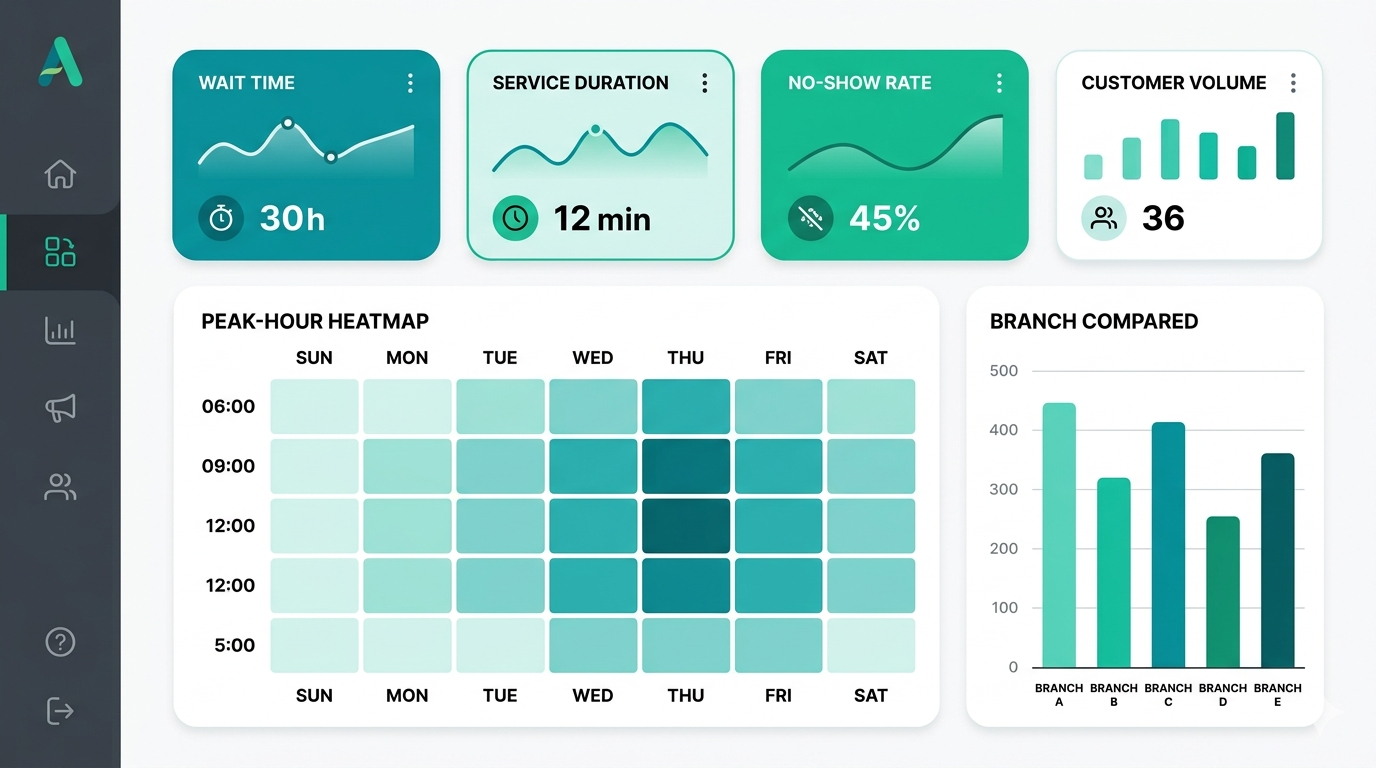
- It tracks KPIs including wait times, service duration, no-show rates, and staff utilization
- It surfaces patterns that instinct and experience alone cannot reliably detect
- Without it, branch management runs on memory, phone calls, and end-of-day reports
- With it, operational decisions become evidence-based, repeatable, and defensible
What Is Operational Analytics for Branches?
Operational analytics for branches is the systematic measurement and analysis of how a branch performs during daily operations. It covers every interaction a customer has with your service floor: how long they waited, how long the service took, whether they completed the journey or left before being served. It captures the same events that a queue management system records at the transaction level, but aggregates them across branches and over time.
A branch analytics platform captures this data automatically across all your locations and aggregates it into dashboards, reports, and trend views. Instead of relying on a manager’s manual observations or an end-of-week summary call, you have a structured record of what actually happened, when it happened, and where.
The difference between operational analytics and a basic queue report is scope and depth. A report tells you what happened today. Analytics shows you what happens consistently, across branches, over time, and gives you the context to understand why. Business analytics researchers draw a clear line between operational analytics, which focuses on improving day-to-day decisions, and traditional business intelligence, which looks at long-term strategic trends. For branch operations, the distinction matters because the problems you need to catch are happening today, not next quarter.
What Does Operational Analytics Actually Measure?
Branch analytics platforms track a range of operational KPIs. The most valuable are the ones that reveal patterns, not just point-in-time data.
Average wait time: How long customers wait before a staff member becomes available. Tracked by branch, service type, and time of day, this metric tells you where and when your capacity is falling short. Consumer research consistently shows that wait time is one of the top factors affecting whether customers return to a service location.
Service duration: How long the actual transaction takes. Unusual spikes in service duration often signal training gaps or process inefficiencies before they appear in satisfaction scores.
No-show rate: Customers who entered the queue but left before being served. A rising no-show rate is an early indicator of a capacity problem, and one of the most undertracked metrics in branch operations.
Customer volume by hour and day: Demand patterns across your branches. This is the foundation for staffing decisions, and the data most operations teams are currently guessing at.
Counter utilization: What percentage of available counters are actively serving customers at any given time. Low utilization during high-demand periods points directly to a staffing or scheduling gap.
Staff performance: Service counts, average handle times, and idle time per staff member. Not for surveillance, but for identifying where coaching or process adjustments will have the highest impact.
What Branch Management Looks Like Without Analytics
Without operational analytics, branch management runs on a combination of instinct, experience, and informal communication. This is not a criticism. It is simply the reality of managing operations with limited visibility.
The typical pattern: something feels off at a branch, so you call the branch manager. The branch manager gives you their perspective. You adjust based on that conversation. The next day, you check in again. If the problem persists, it escalates. If it does not, you assume it resolved.
This process has two structural problems. First, it is entirely reactive. You find out about problems after they have already affected customers. Second, it is based on reported information rather than measured data. What the branch manager tells you and what the numbers show are not always the same thing.
The deeper consequence is that patterns stay invisible. A branch that consistently underperforms on Wednesday afternoons never surfaces as a pattern. It shows up as individual problems that get handled individually, every week. Staffing decisions are made based on what “usually” happens rather than what the data confirms. And when performance is questioned from above, the answer is a narrative rather than evidence.
Organizations using structured branch analytics consistently identify recurring patterns within the first 60 days. Some of those patterns are predictable enough to prevent entirely once they are visible.
What Changes When You Have It

The shift that operational analytics creates is not primarily about dashboards. It is about the quality of decisions that become possible.
With historical trend data, staffing decisions are grounded in actual demand patterns. You know which branches need two counters open by 10am on Sundays and which can run lean until midday. You know that no-show rates spike at a particular branch every quarter-end, which means the problem is predictable. Predictable problems can be prevented.
Branch-to-branch comparisons surface performance gaps that would otherwise stay hidden. When one branch consistently handles significantly more customers per hour than another with similar staffing, that gap is worth understanding. It might point to a process difference, a training gap, or a layout issue. But you cannot investigate something you cannot see.
The accountability dimension also shifts. When performance is questioned, the answer is no longer a narrative. It is data: what the numbers were, what changed, and what was done about it. That shift from instinct to evidence changes the nature of operational conversations at every level of the organization.
Across organizations that have moved from manual reporting to structured branch analytics, the consistent finding is not that problems increase once the data is visible. It is that the right problems finally get attention.
What to Look for in a Branch Analytics Platform
Not all analytics platforms are built for multi-branch operations. These are the capabilities that matter most when evaluating one.
Branch-level filtering: Aggregate data is useful for identifying trends. But when you need to investigate a specific branch or compare two locations, you need to filter to that level without losing the broader context.
Historical depth: Patterns take time to form. A platform that shows you the last seven days is useful for operations. A platform that shows you the last twelve months is useful for decisions.
Automated reporting: Dashboards require active monitoring. Automated daily, weekly, or monthly reports delivered by email ensure the data reaches the right people without requiring them to obsess over the dashboard.
Staff-level visibility: Branch-level data tells you where the problem is. Staff-level data helps you understand why. Both are necessary for meaningful operational improvement.
BI tool integration: If your organization uses Power BI, Tableau, or similar tools, the analytics platform should export data in formats that connect to those systems. Operational data should feed into broader organizational reporting, not sit in a separate silo.
Role-based access: Branch managers should see their branch. Regional managers should see their region. Finance should see cost-relevant metrics. Access structure matters as much as data depth.

Key Takeaways
- Operational analytics for branches is the systematic collection and analysis of service floor data across all your locations.
- Core KPIs include wait times, service duration, no-show rates, customer volume, counter utilization, and staff performance.
- Without analytics, branch management relies on reactive communication and reported information rather than measured patterns.
- With analytics, staffing decisions, performance reviews, and operational adjustments are grounded in evidence rather than instinct.
- When evaluating a platform, prioritize branch-level filtering, historical depth, automated reporting, staff-level visibility, BI integration, and role-based access.
- Branches that perform well do not always do so by instinct alone. The data shows what experience cannot reliably track across multiple locations.
Waqtak is a cloud-based queue management system built for multi-branch service organizations.

The Decisions You’re Making Without the Data to Back Them
Last quarter, you made three operational decisions. You moved a staff member from Branch 6 to Branch 3…

How to Choose an Analytics Platform for Your Multi-Branched Operation
The question is not whether your branches produce data. They do, every hour they are open. The question…

The Benefits of Operational Analytics for Multi-Branched Companies
The benefits of operational analytics for branches show up most clearly in the decisions it changes, not the…
Want to see how this works in practice?
Book a personalized demo and we will walk you through how Waqtak closes these blind spots for an operation like yours.
Book a Demo