Stop Managing by Gut Feeling.
Start Managing by Data.
Every customer interaction generates data. Most organizations never see it. Waqtak captures, structures, and surfaces the metrics that matter, so your decisions are based on what’s actually happening, not what you think is happening.
Your Customer Experience Isn’t Consistent
Your service quality varies by branch, by day, by hour. But you only find out at the end of the week, or when a complaint reaches your desk.
Not Having Information Results in Suboptimal Decision Making
You’re making staffing decisions, setting service standards, and reporting to leadership based on delayed, incomplete data. You’re doing your best with what you have. It’s not enough.
The Technology Already Exists
Every operational decision you make, staffing levels, branch hours, service capacity, has a measurable effect on customer experience. That effect is worth measuring.
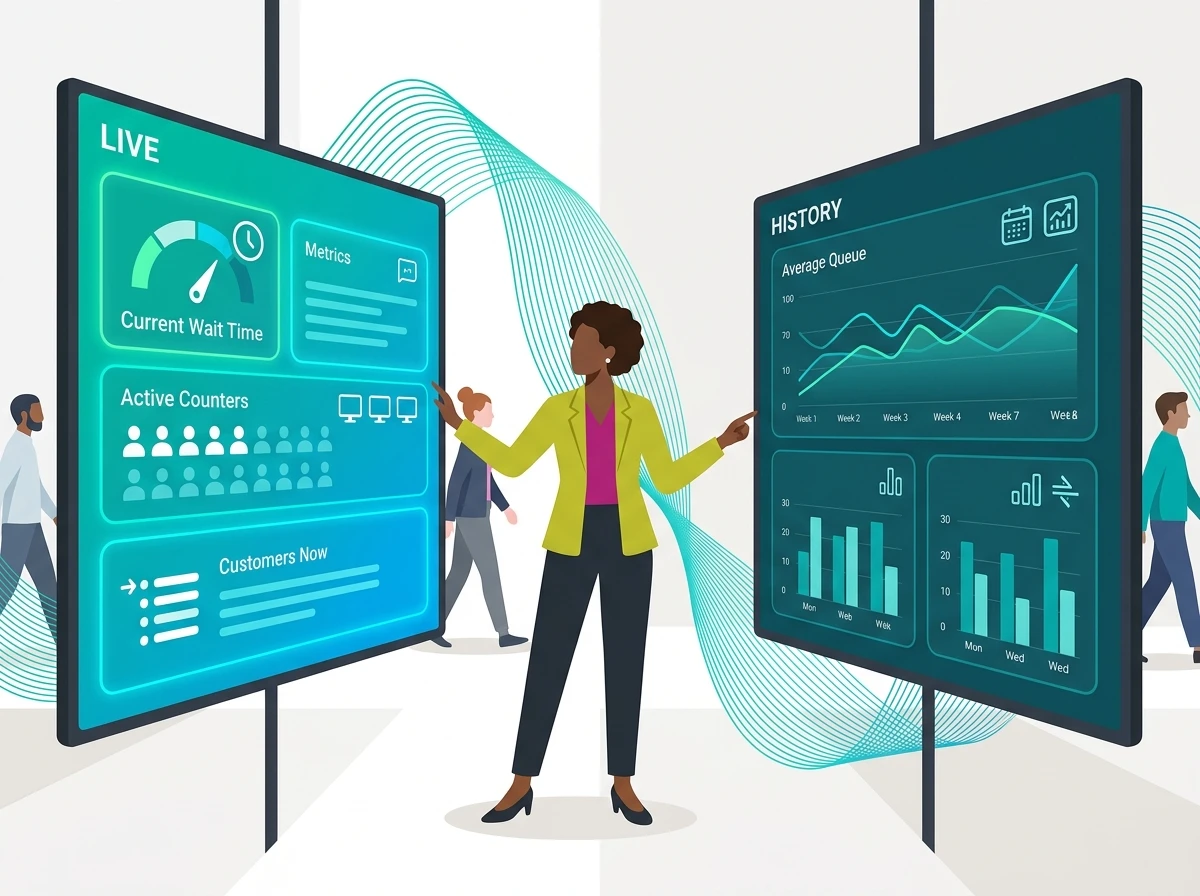
See What’s Happening Now and What Happened Before
Real-time data tells you what to fix today. Historical data tells you why the problem keeps coming back. Waqtak gives you both, a live operational view and a full archive of service performance going back as far as you need, filtered by any dimension you choose.
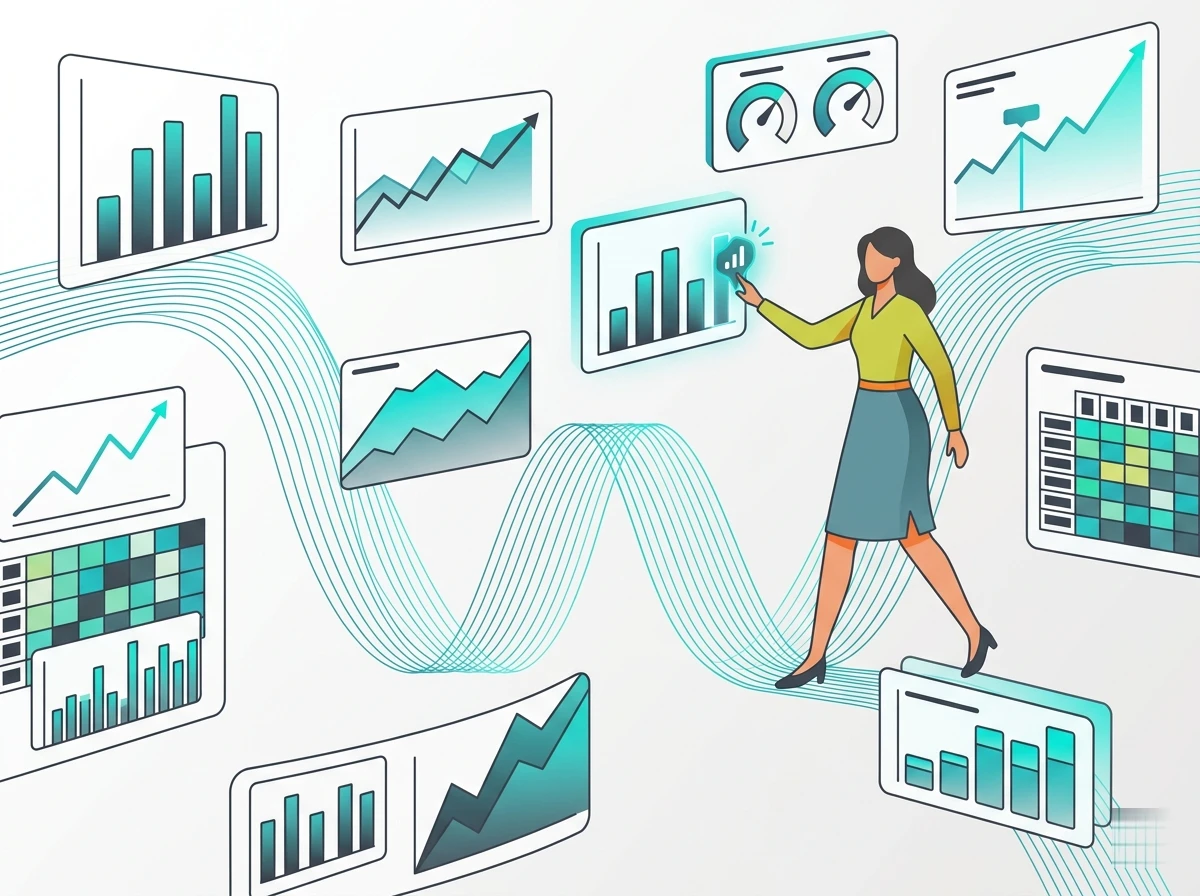
Every Number That Affects Your Service Quality, Tracked Automatically
Waqtak tracks the metrics that tell the real story of your customer experience, not vanity numbers, but the operational KPIs that drive decisions. Average wait time. Service time. No-show rates. Customer volume by hour. Counter utilization. Staff performance. All of it, automatically.
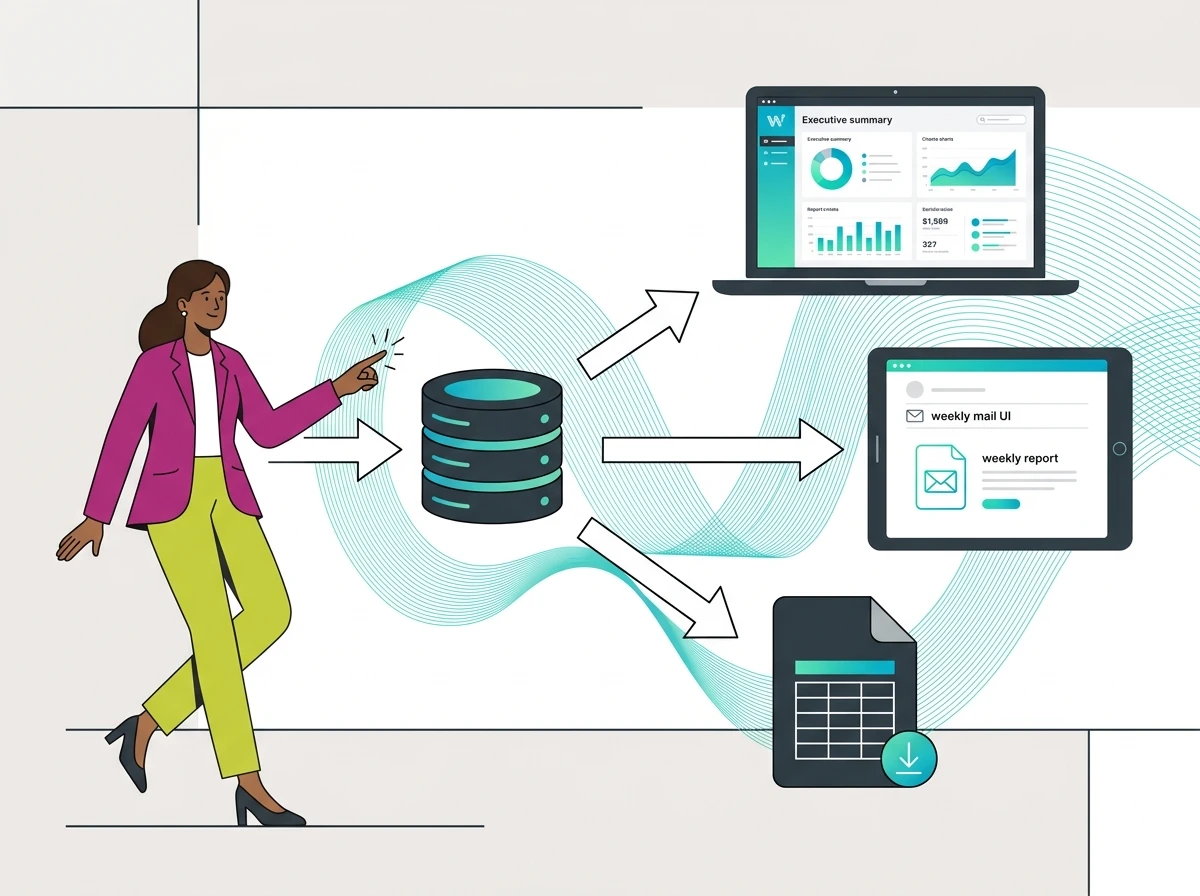
The Right Report for the Right Audience, Automatically
Not everyone needs the same data. Your counter supervisor needs yesterday’s numbers. Your regional manager needs a weekly branch comparison. Your CEO needs a monthly executive summary. Waqtak delivers each, automatically, in the format each person needs.
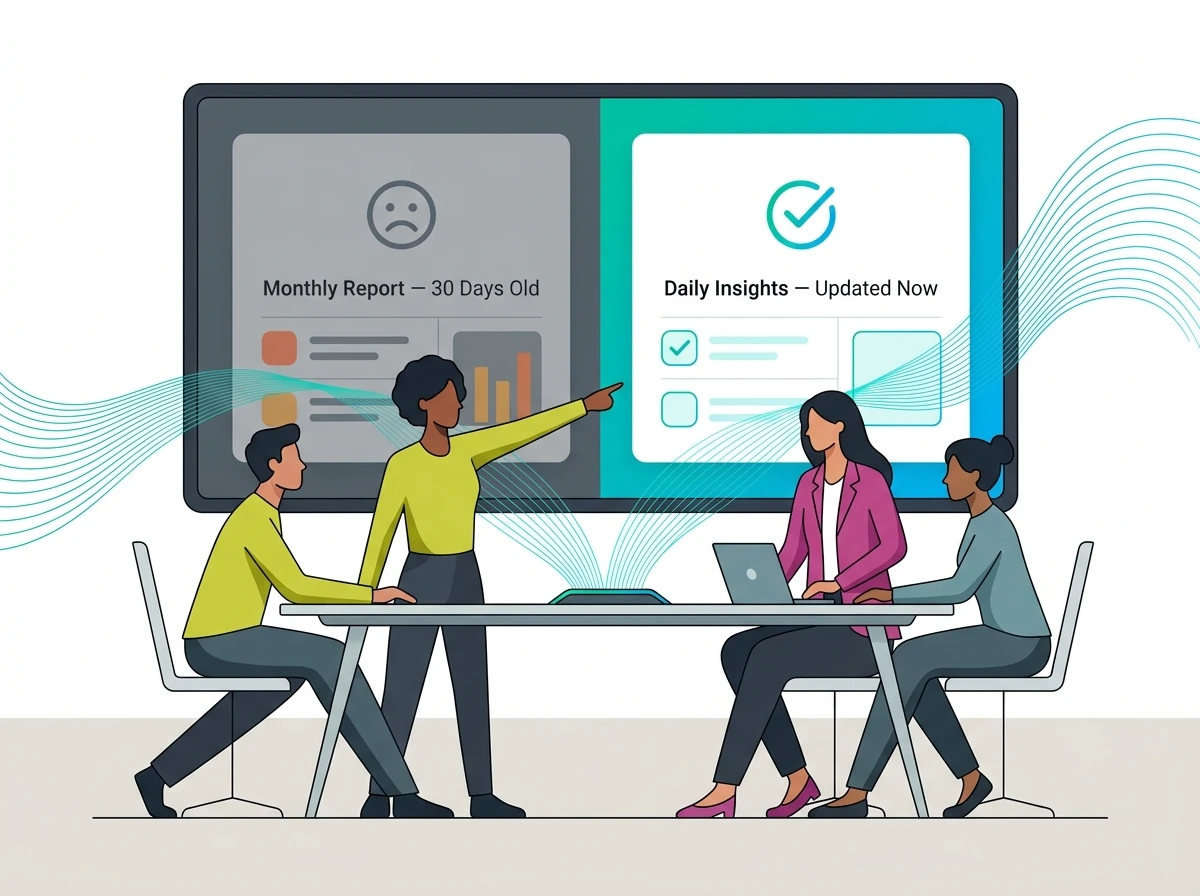
From Monthly Reports to Daily Insight
Organizations that run on data don’t just perform better, they improve faster. When your leadership can see exactly which branches are underperforming and why, the conversation shifts from blame to solution. When your managers can see peak hours before they happen, staffing decisions become proactive. When your staff know their performance is visible, standards rise.
Decisions Based on Facts
Every staffing and operational decision backed by real data.
Continuous Improvement
Performance trends visible week over week, month over month.
Leadership Confidence
Reporting to leadership with data instead of estimates.
Government
Prove service quality to ministry leadership with trackable KPIs and citizen satisfaction scores.
Banking & Exchanges
Identify peak-hour staffing gaps before they cost you customers.
Healthcare
Track patient flow across departments to optimize resource allocation.
Telecom
Compare store performance across regions with data, not anecdotes.
NGOs & International
Generate donor-ready service delivery reports automatically.
Retail
Identify your highest and lowest performing stores, and act on the difference.
What Would You Do With Real Data About Your Service Operations?
Book a demo and we’ll show you exactly what Waqtak captures at an operation like yours.
What Would You Do With Real Data About Your Service Operations?
Book a demo and we’ll show you exactly what Waqtak captures at an operation like yours.