A queue management system does two things at once: it organizes your customer flow and generates the data your operation has been missing. Most organizations focus on the first part. This article talks about benefits of a queue management system when it comes to the second.
The customers who cost you most are not the ones who complain about the wait. They are the ones who leave before they are called, and never appear in your data at all.
If you manage multiple service branches and you’re still relying on end-of-day reports and staff calls to understand how the day went, you’re not managing your operation. You’re hearing about it after the fact.
Here’s what changes when a queue management system is in place.
The 5 Benefits of a Queue Management System at a Glance
- You know exactly how long your customers are waiting, and where the bottlenecks are.
- You see every customer who left without being served, with a timestamp.
- Your staffing schedule is based on real demand patterns, not repeated guesses.
- You can compare every branch side by side on the same metrics.
- You have service quality data ready when leadership asks for it.
Your Customers Wait Less, and You Know Exactly How Much Less
The typical starting point for most organizations implementing a queue management system is a simple goal: shorter lines. What they discover is something more useful: visibility.
Without a system, you don’t know your average wait time. You don’t know which branch is fastest. You don’t know whether Tuesday mornings are consistently your worst period or whether last week was an exception. You’re managing by anecdote.
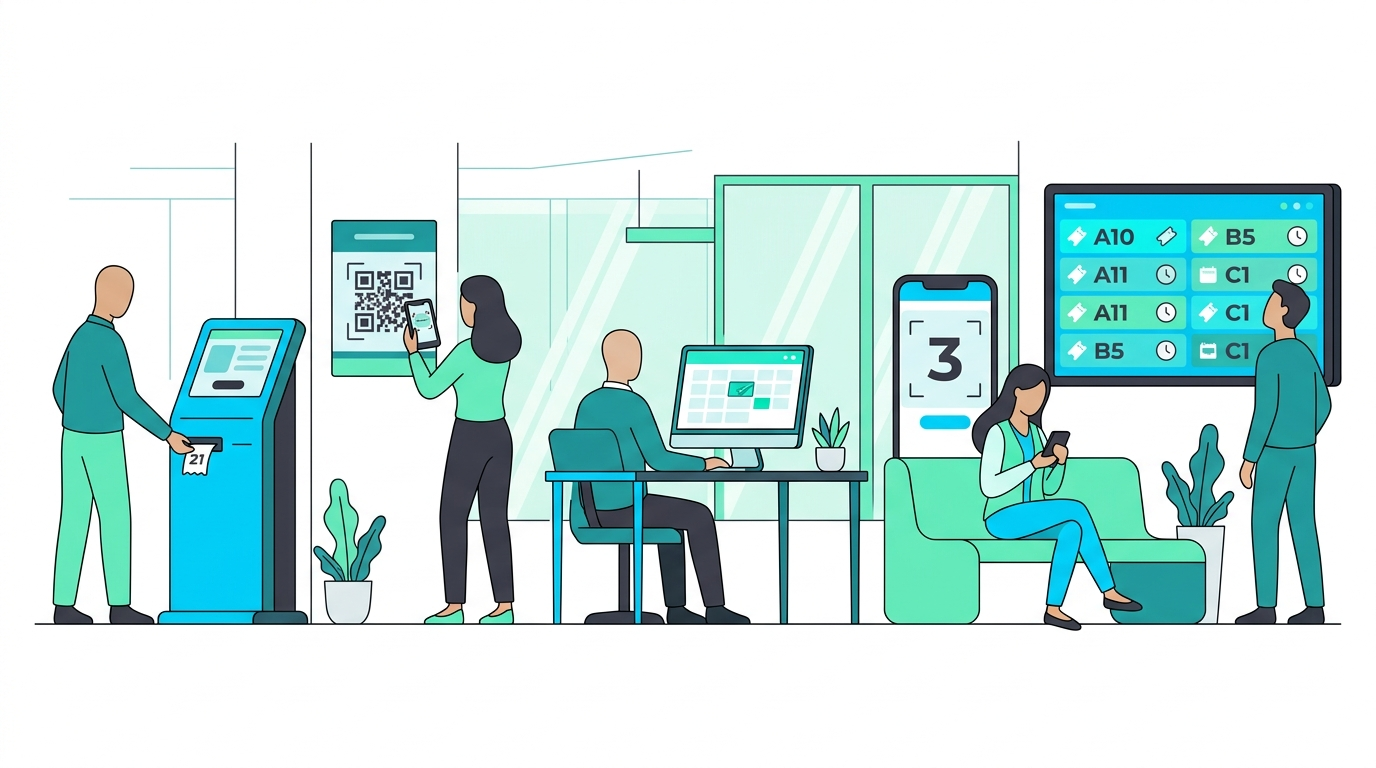
With a queue management system, every ticket is timestamped. Issue time, call time, service start, service end. The system builds a picture of your operation automatically: average wait time per branch, per service type, per hour, per day of week.
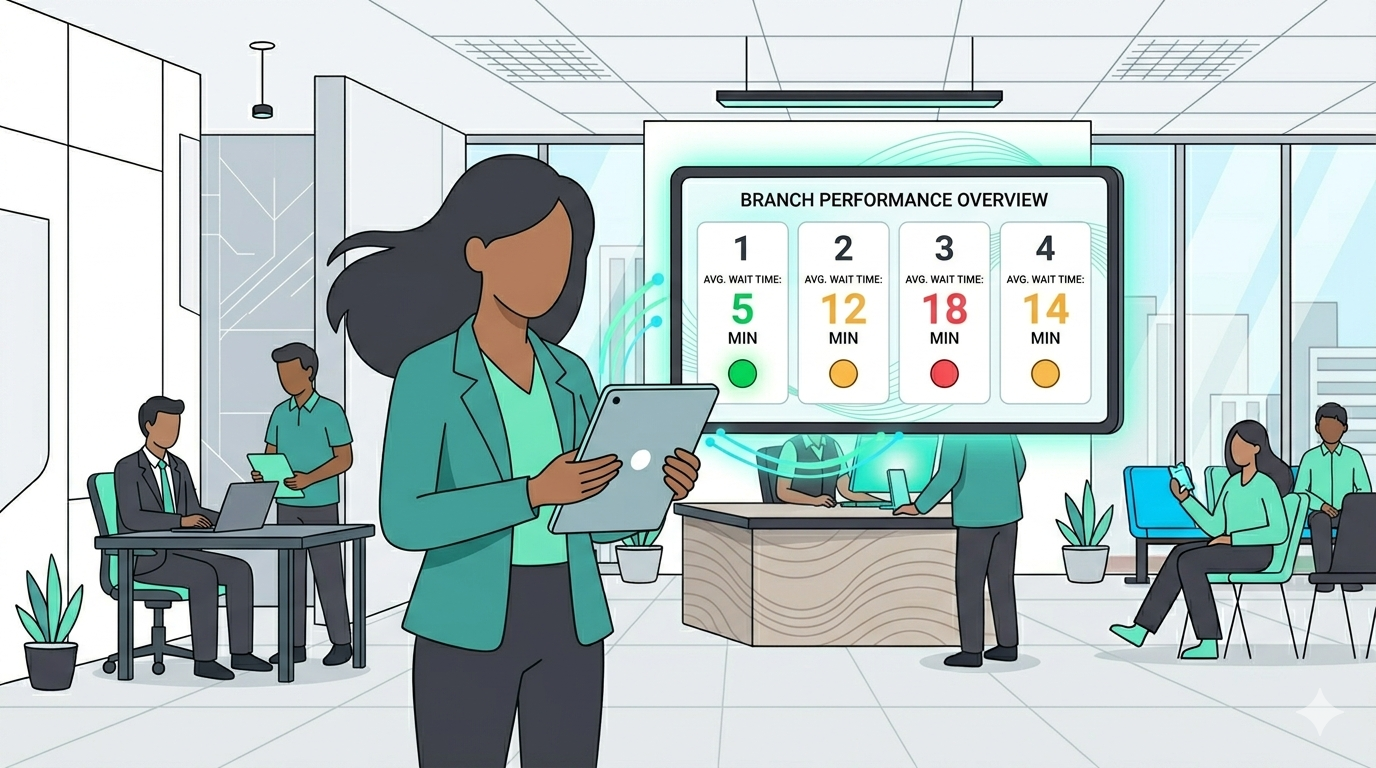
Organizations that implement Waqtak see an average 40% reduction in wait times. Not because the software is magic, but because visibility creates accountability. Once you can see that Branch 3 averages 18 minutes while Branch 7 averages 6, the question of what Branch 3 is doing differently has an answer.
In practice
A branch manager in a 12-branch telecom network starts Monday knowing nothing about last Friday’s performance. With a QMS, Monday’s first check shows Friday at 3pm was the week’s worst hour at two specific branches. She has the data to act before the same thing repeats this Friday.
You See Every Customer Who Left Without Being Served
Walk-outs are the metric most organizations don’t track, because without a queue management system, there’s no mechanism to track them. The customer picks up a number, waits, decides it’s too long, and leaves. No record. No cost attributed. No alarm raised.
With a queue management system, every customer who takes a ticket and doesn’t reach a counter is logged. You know the timestamp, the branch, the service type, and how long they waited before giving up.
Most operations managers are surprised when they see their walk-out rate for the first time. Organizations using Waqtak report up to 70% fewer walk-aways after implementation, a reduction that only becomes possible once you can first measure the problem. Eight to ten abandoned tickets per day at a branch doesn’t feel significant. Multiply it by 22 working days and calculate the service value of each interaction, and it becomes a number leadership can’t ignore.
In practice
A government service center has always assumed abandoned queues are rare. After implementing a QMS, the first month’s data shows 340 walk-outs across five branches. That finding goes directly into a staffing review. The number drops by 60% within two months, not because anything dramatic changed, but because the problem finally had a number attached to it.
Your Staffing Decisions Are Based on Data, Not Habit
Most service branches run the same schedule every week. The same counters are open at 9am regardless of whether 9am is slow or busy. The same staff coverage applies on Monday and Wednesday even if Wednesday is twice as busy. These decisions aren’t made strategically. They’re made by habit, and by the absence of a reason to change.
A queue management system breaks that pattern. You know peak hours, peak days, and which service types drive the most volume. You know whether your Thursday staffing is appropriate for Thursday traffic or just inherited from a schedule set three years ago.
The result is rarely adding headcount. It’s redistributing the staff you already have. Moving one person from a consistently slow period to a consistently busy one can reduce average wait times by several minutes across the day. Waqtak clients report a 30% average boost in staff efficiency after implementation.
In practice
A banking network uses the same counter setup across all branch hours. QMS data shows that between 11am and 1pm, average wait times spike to 19 minutes while the 8-9am slot averages 4 minutes. Shifting two agents to midday coverage costs nothing. Average wait time in that window drops to 9 minutes within the first week.
You Can Compare Every Branch Side by Side
Running multiple branches without a unified data system means each branch operates in isolation. Managers report upward and leadership hears summaries. When things are going well, you don’t know why. When performance dips, you don’t know where the gap is.
A queue management system creates a common set of metrics across every branch: average wait time, peak hour volume, service duration per transaction type, walk-out rate. When all branches run on the same system, comparison becomes automatic.
This isn’t a tool for blame. It’s a tool for transfer. If Branch A consistently serves customers in 6 minutes and Branch B takes 14 for the same service type, that gap represents a question worth asking: what is Branch A doing that Branch B isn’t? Without comparable data, that question can’t even be formed. With it, it becomes a standard management conversation.
In practice
An operations director managing 20 government service centers has always assumed performance variation is normal and unquantifiable. First quarter reports from the QMS show a 3x difference in average service time between the fastest and slowest branches for the same transaction type. That finding drives a cross-branch review that brings the slowest branches to within 20% of the network average within one quarter.
You Have Numbers When Leadership Asks for Them
The most strategically important benefit isn’t visible to customers. It shows up in board presentations, budget reviews, and compliance audits.
When the question is “how is service quality performing across the network?”, the answer without a queue management system is qualitative at best: no major complaints, teams are working hard, nothing critical to report. That answer doesn’t support investment decisions. It doesn’t satisfy auditors. And it doesn’t help justify a budget request.
With a queue management system, that answer becomes a set of measurable trends: wait time over the quarter, walk-out rate by branch, throughput per agent, satisfaction scores over time. The 95% customer satisfaction rate Waqtak clients report isn’t a claim. It’s a figure that exists because the system measures it.
For organizations operating under national performance standards, government transformation mandates, or sector-specific regulatory requirements, service quality isn’t optional to report. Having it measured, tracked, and accessible moves service quality from a management aspiration to an auditable record.
In practice
A healthcare network preparing for an annual service quality audit previously spent three weeks collecting manual reports from each facility. With a QMS, the audit report is a dashboard export. Average wait times by department, by facility, and by month are available in minutes. Audit prep time drops from three weeks to two days.
Who Benefits Most?
Operations directors managing five or more branches see the fastest return. The more branches you have, the more data points you gain, and the more visible performance gaps become. For a single-branch operation, a queue management system adds visibility. For a ten-branch network, it transforms how decisions are made.
Industries with high foot traffic and multiple service types, including government, banking, healthcare, and telecom, see the highest ROI. High transaction volume generates more data. More data means faster pattern recognition and faster operational improvement.
The threshold for benefit isn’t size. It’s whether you’re currently making staffing, scheduling, and service quality decisions without data. If you are, a queue management system doesn’t just add a tool. It adds the information layer your operation has been missing.
Key Takeaways
- A queue management system reduces average wait times by 40%, but more importantly, it shows you exactly where waits are highest so you can act on the information.
- Walk-outs are invisible without a tracking system. Organizations implementing QMS see up to 70% fewer abandoned queues once they can measure and address the problem.
- Staffing efficiency improves by an average of 30% when scheduling is based on actual demand patterns rather than habit.
- Branch comparison becomes possible when all locations share the same metrics. Performance gaps stop being assumptions and start being addressable data points.
- Service quality becomes reportable, auditable, and defensible, which is what makes QMS investment easy to justify to leadership.
Waqtak is a cloud-based queue management system built for multi-branch service organizations.

What Your Operation Loses Without a Queue Management System
Right now, someone is walking into one of your branches. They will look around, figure out where to…

How to Choose the Right Queue Management System
Most organizations approach this decision the wrong way. Features get evaluated before requirements are understood. Price gets compared…
Types of Queue Management Systems
There are five main types of queue management systems, each handling customer flow in a different way: Linear…
Want to see how this works in practice?
Book a personalized demo and we will walk you through how Waqtak closes these blind spots for an operation like yours.
Book a Demo