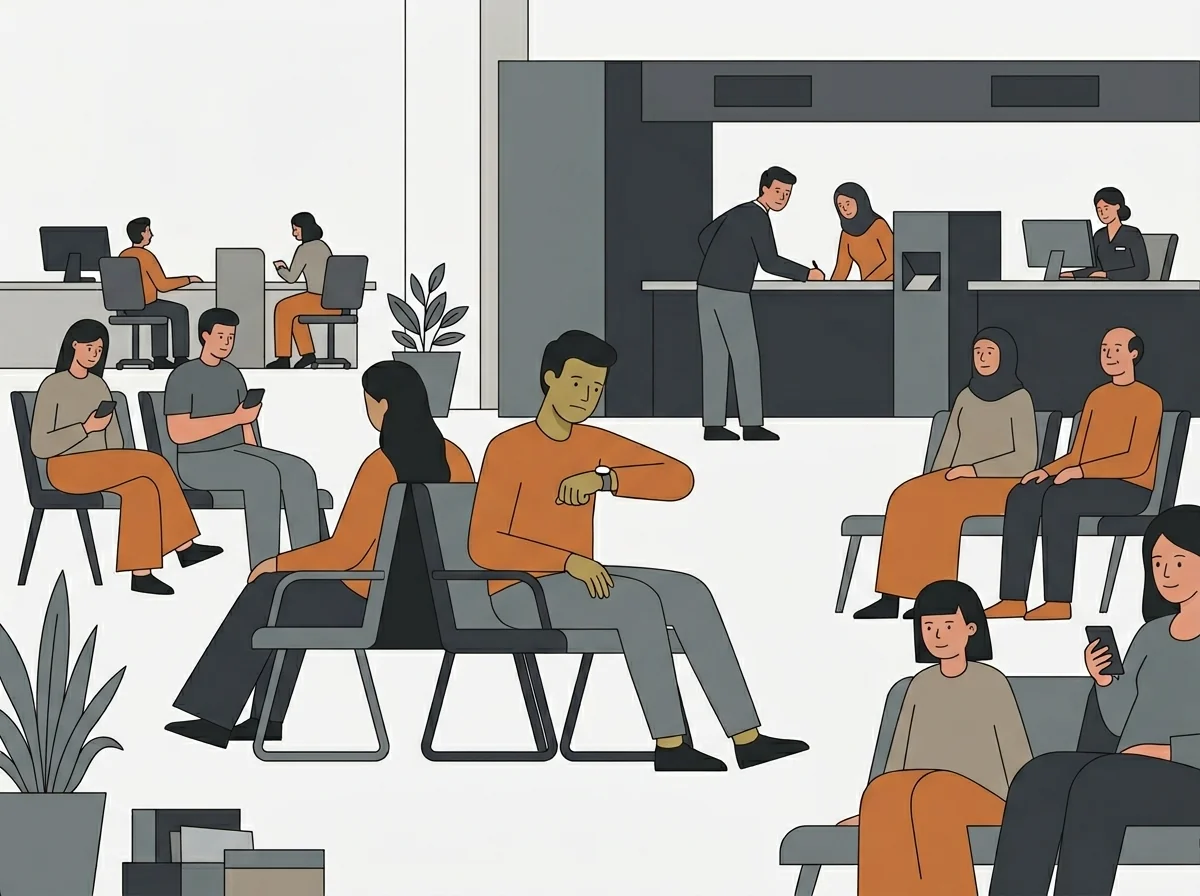
Right now, someone is walking into one of your branches. They will look around, figure out where to go, wait in something that resembles a line, get served, and leave. You will never know how long any of that took. You will not know if they almost left. You will not know if three people before them actually did leave. By tomorrow, the only trace of today’s service is a vague sense that it was “busy” or “fine.”
A queue management system is not, at its core, a tool for managing lines. It is the system that collects data at every friction point a customer experiences in your branch: the moment they arrive and look for direction, the moment they join a queue and start waiting, the moment they decide whether to stay or leave, and the moment they are served or transferred. Without it, every one of those moments passes through your operation unrecorded. What you lose is not just efficiency. It is the ability to see your operation clearly.
This is how most multi-branch organizations operate. Not because the people running them do not care, but because they have never had a system that captures what is actually happening on the floor. The result is a daily blind spot: hundreds of customer interactions across your branches, and almost none of them measured.
How Many People Walked Into Your Branches Today?
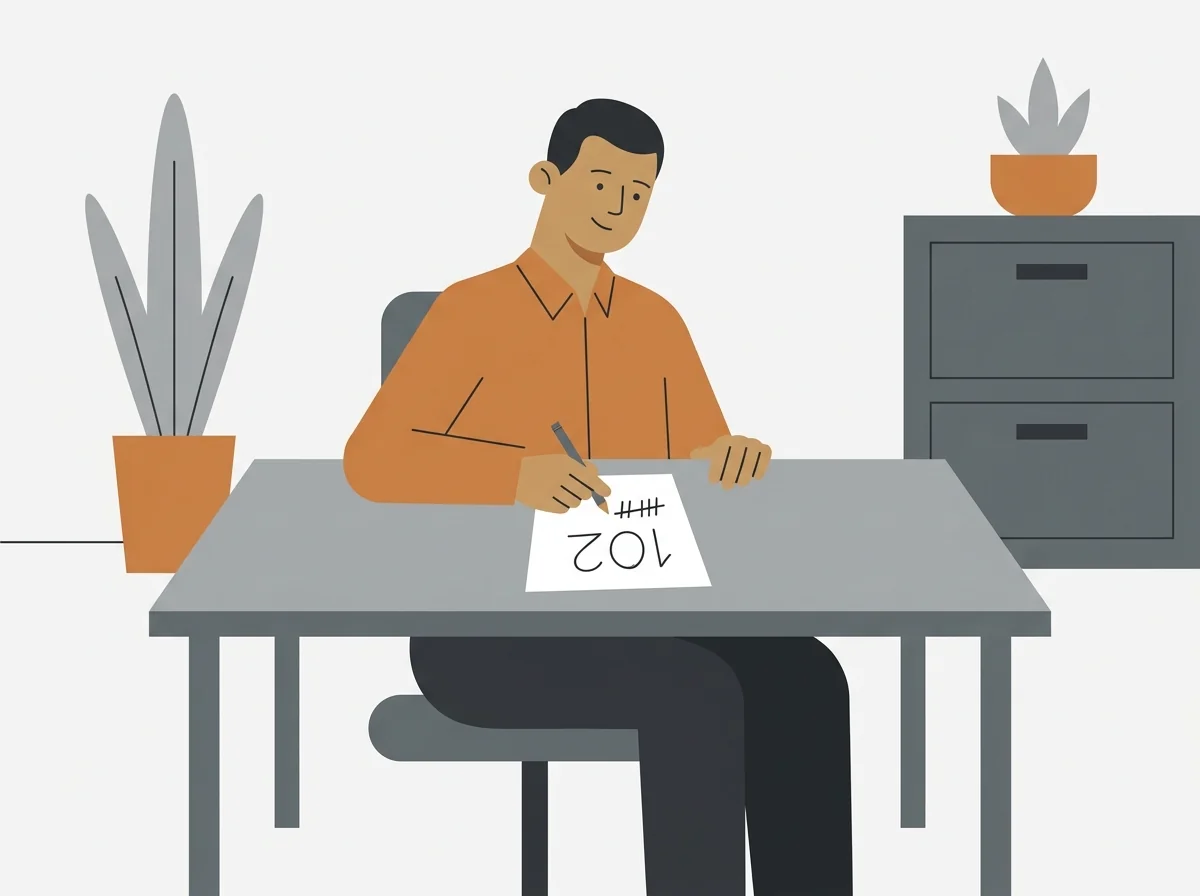
You probably know the answer. Most organizations track footfall at some level, even if it is just a manual tally or a turnstile count.
Now try answering these:
- ?How many of those people were served within 15 minutes?
- ?How many waited longer than 30 minutes?
- ?How many walked out before being served?
- ?Which branch had the longest average wait time?
- ?Which counter served the most customers?
- ?Which service type took the longest?
- ?What time did your queues peak, and were you staffed for it?
If you cannot answer most of these, you are running your operation on one data point when your floor is generating dozens. That gap between what is happening and what you know is where service quality silently deteriorates.
What Happens in the Gap
When you cannot see the details of your service floor, three things happen. They happen slowly, which is why they are easy to miss.
1. Walk-outs become invisible
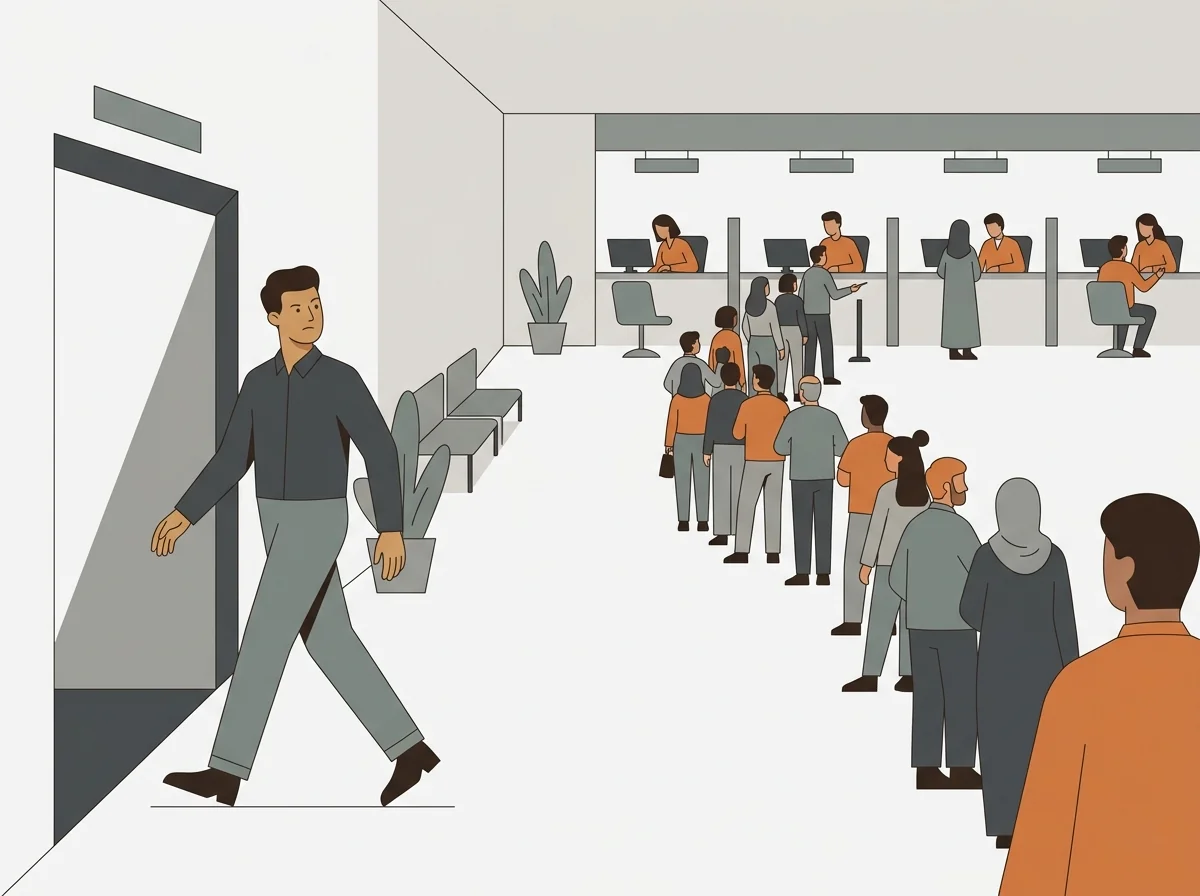
A customer joins the queue, waits 20 minutes, gives up, and leaves. In most branches, nobody records this. The customer does not file a complaint. The front desk does not log it. The branch manager might notice the waiting area got emptier, or might not.
Industry data suggests that the average customer will abandon a queue after 8 minutes of waiting. If your branches serve 200 people a day across 5 locations, and even 5% walk out untracked, that is 50 lost interactions per day. Over a year, that is more than 18,000 customers who came to you, needed something, and left without getting it.
You did not lose them to a competitor’s better product. You lost them to a wait they decided was not worth it. And because nobody recorded it, you have no way to know it is happening, let alone fix it. Walk-out rate is one of the most persistent blind spots in branch operations precisely because there is nothing to see: the customer is simply gone.
2. Staffing decisions become guesswork
Without data on when queues peak, how long services take, and which counters are underutilized, staffing is based on habit. You schedule the same number of people for Tuesday as you do for Thursday because you do not have evidence that Tuesday is 40% busier.
The cost of this is not dramatic. It is chronic. Slightly overstaffed during slow hours, slightly understaffed during peak hours, multiplied across 10 branches and 250 working days. No single day feels like a crisis, but the cumulative effect on service quality and operating cost is significant.
3. Complaints become your only feedback loop
When you do not measure the service experience systematically, the only signal you receive is complaints. But complaints are the tip of the iceberg. Research consistently shows that for every customer who complains, 26 others stay silent. They simply do not return.
This means your understanding of service quality is shaped entirely by the small percentage of customers frustrated enough to say something. The rest, the ones who waited too long, who felt ignored, who had a mediocre experience, disappear without a trace. The complaints that reach you point at the symptom. Without floor data, you cannot see the cause.
The 8 Data Points Your Floor Is Already Generating
Every time a customer walks into a branch with a service queue, these data points are created whether you capture them or not:
| # | Data Point | What It Tells You |
|---|---|---|
| 1 | Arrival time | When customers show up. Reveals peak hours and demand patterns. |
| 2 | Service type requested | What customers need. Shows which services drive the most volume. |
| 3 | Wait time | How long between arrival and being served. Your primary service quality metric. |
| 4 | Service time | How long the actual interaction takes. Varies by service type, staff member, and complexity. |
| 5 | Counter/agent assignment | Who served whom. Enables staff performance comparison. |
| 6 | Walk-out events | Customers who left before being served. Your invisible loss metric. |
| 7 | Transfer events | Customers moved between counters or services. Indicates routing problems or misclassification. |
| 8 | Completion status | Whether the interaction was completed, abandoned, or deferred. Closes the loop on each visit. |
In a branch with no queue management system, most of these data points evaporate the moment they occur. A few might end up in a manual log. Most do not exist in any record. Without a system to capture them, these data points represent a blind spot that grows wider with every branch you add to your network.
In a branch with a queue management system, every data point is captured automatically, timestamped, and tied to a specific branch, counter, service type, and staff member. With that data, you can rebalance staffing to match actual demand, identify the friction points driving walk-outs, and compare branch performance with precision rather than instinct.
What Would You Do Differently With This Data?
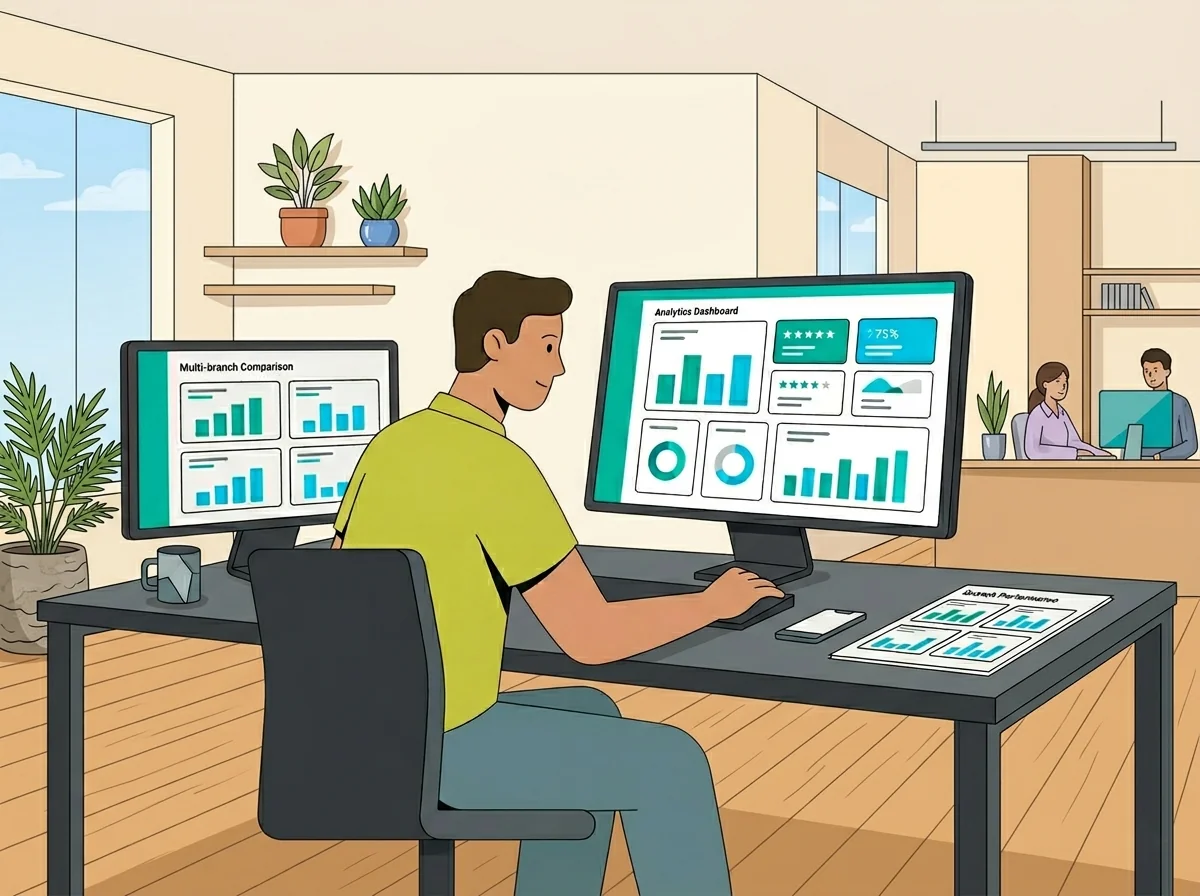
This is not a rhetorical question. Consider your last month of operations and ask yourself:
If you knew which hours were your busiest, would you staff the same way? Most organizations that start measuring peak hours discover that 60 to 70% of their daily volume arrives in a 3-hour window. The other 5 hours of the workday are comparatively quiet. That is a staffing rebalance waiting to happen, and the data tells you exactly when and by how much.
If you knew your walk-out rate, would you tolerate it? Organizations that begin tracking walk-outs for the first time are almost always surprised by the number. What felt like “a few people leaving” turns out to be 8 to 12% of daily visitors at some branches. Attaching a number to a problem changes how seriously it gets treated.
If you could compare branches side by side, would you manage them the same way? One branch serves customers in 6 minutes on average. Another takes 14 for the same service. Without data, both branch managers report that things are running smoothly. When government service centers or bank branches start seeing this data side by side, the performance gap becomes undeniable.
If you could see service time by staff member, would your performance conversations change? Averages hide outliers. One agent might handle 40 customers a day while the person at the next counter handles 22. Without per-agent data, both get the same review.
Why Most Organizations Do Not Capture This Yet
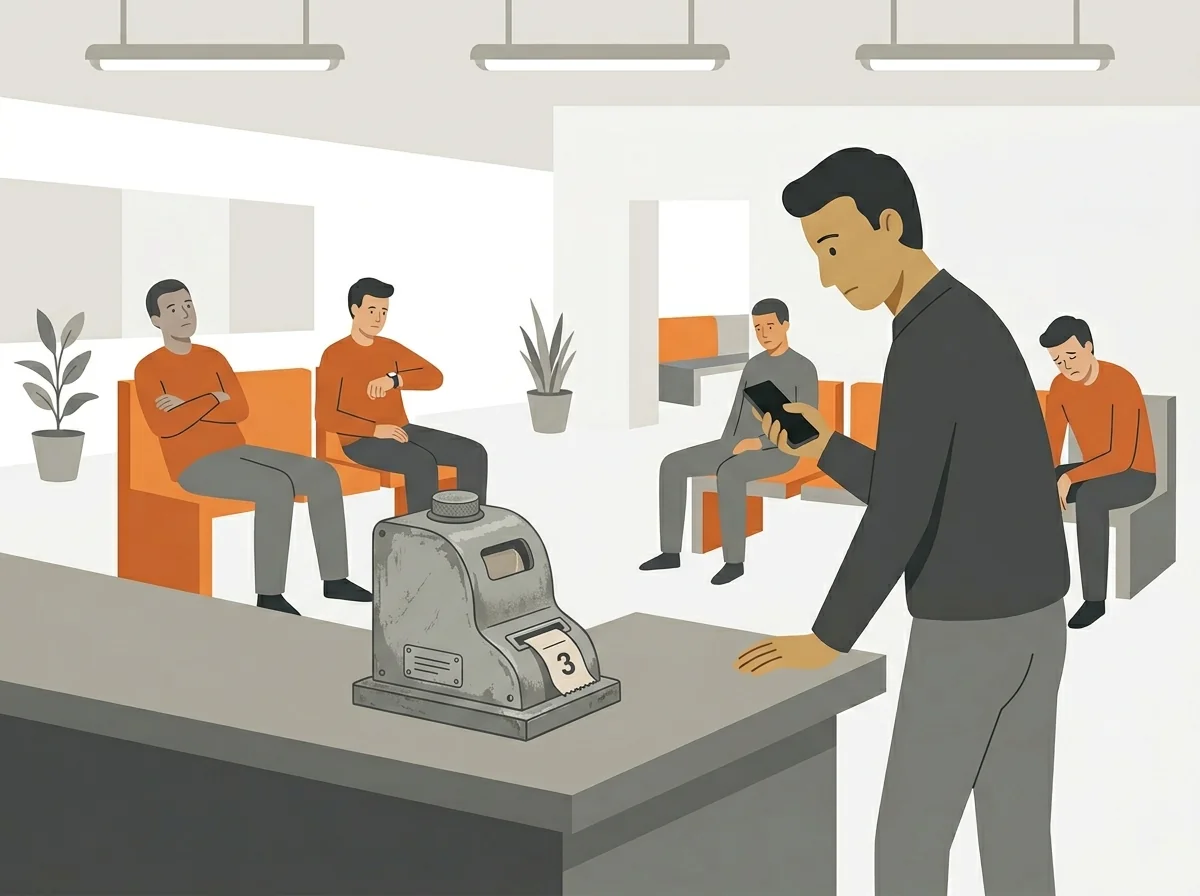
If the data is this valuable, why is it not being collected everywhere?
1. The existing system “works.”
Take-a-number dispensers, basic ticketing machines, or no system at all. These have been the default for decades. They technically manage the queue in the sense that people are served in some order. But they capture little to no data. Organizations that have operated this way for years do not feel a specific pain; they feel a general limitation they have learned to live with.
2. The cost assumption is wrong.
Many decision-makers assume that a queue management system is a large capital investment: hardware, installation, training, ongoing maintenance. Modern cloud-based systems have changed this significantly. The cost of not knowing, measured in lost customers, misallocated staff, and undetected problems, frequently exceeds the cost of the system itself within months.
3. Nobody owns the problem.
The branch manager deals with the queue on the ground. The operations director worries about service quality across locations. IT handles the technology. Finance controls the budget. When a problem sits at the intersection of four departments, it often sits there indefinitely. Someone has to decide that floor-level service data is a priority, and that person is usually the operations leader who is tired of making decisions without evidence.
The Shift: From Guessing to Knowing
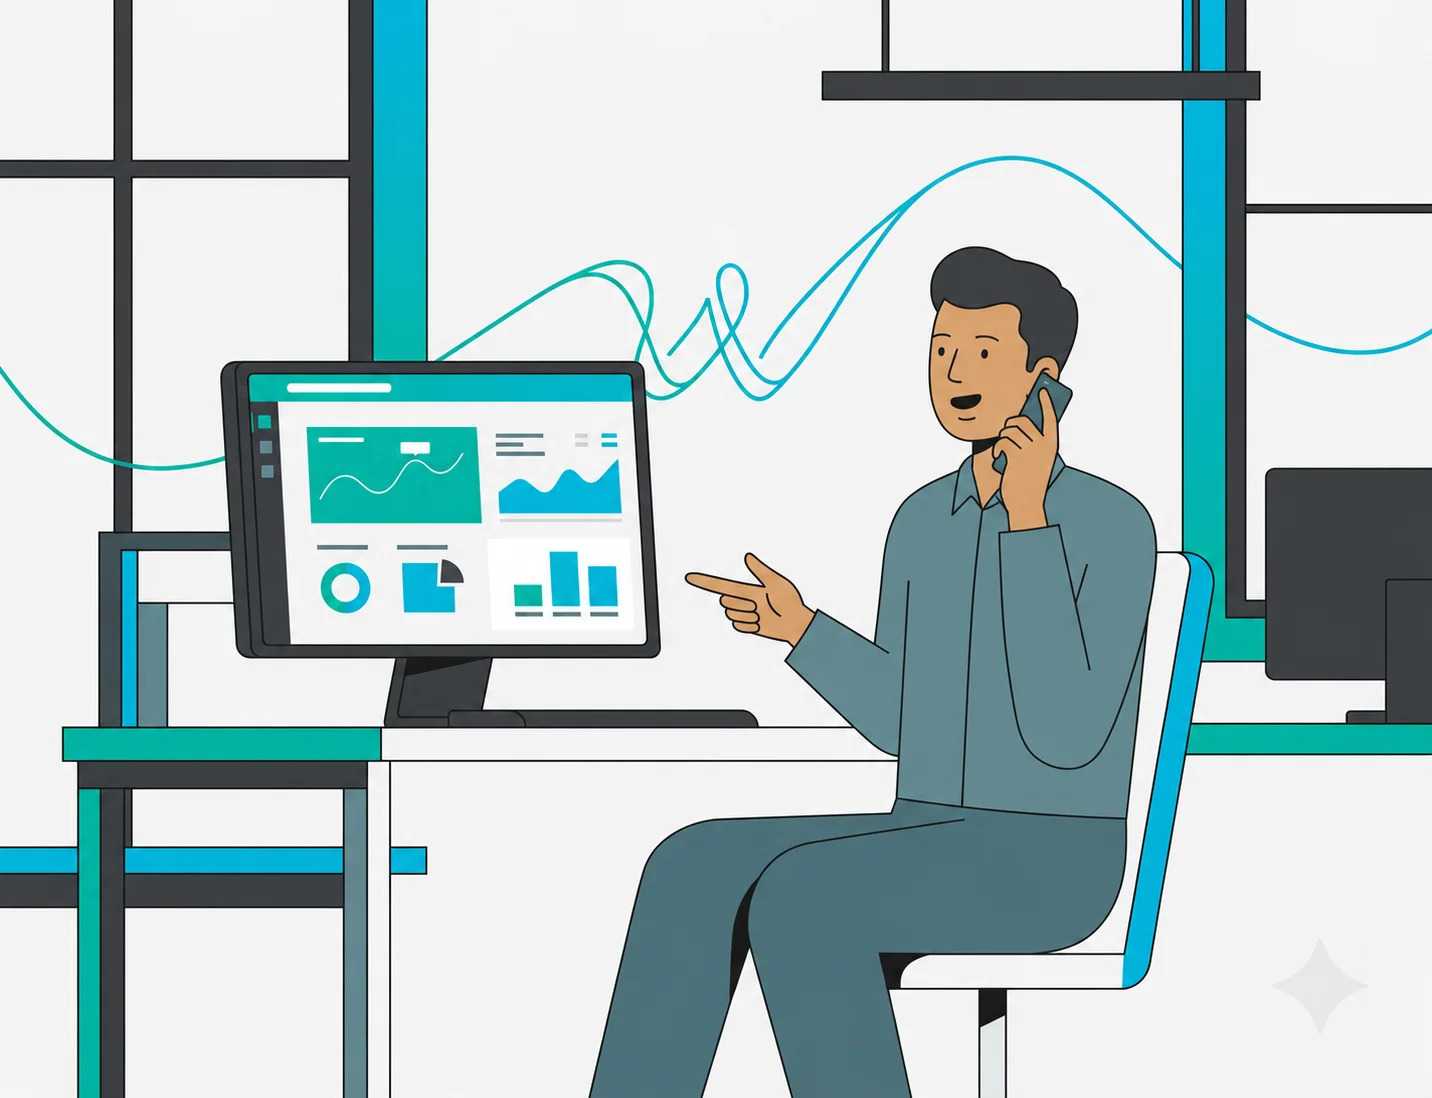
The difference between a branch with no data and a branch with a queue management system is not just operational. It changes the kind of conversations you can have.
These are not hypothetical improvements. Organizations that implement queue management systems consistently report 40% reductions in wait times and significant decreases in walk-out rates. Not because the system does something remarkable, but because it closes the blind spot on the floor. Once you can see the problem clearly, you can fix it. Once you can measure the fix, you know it worked.
Where to Start
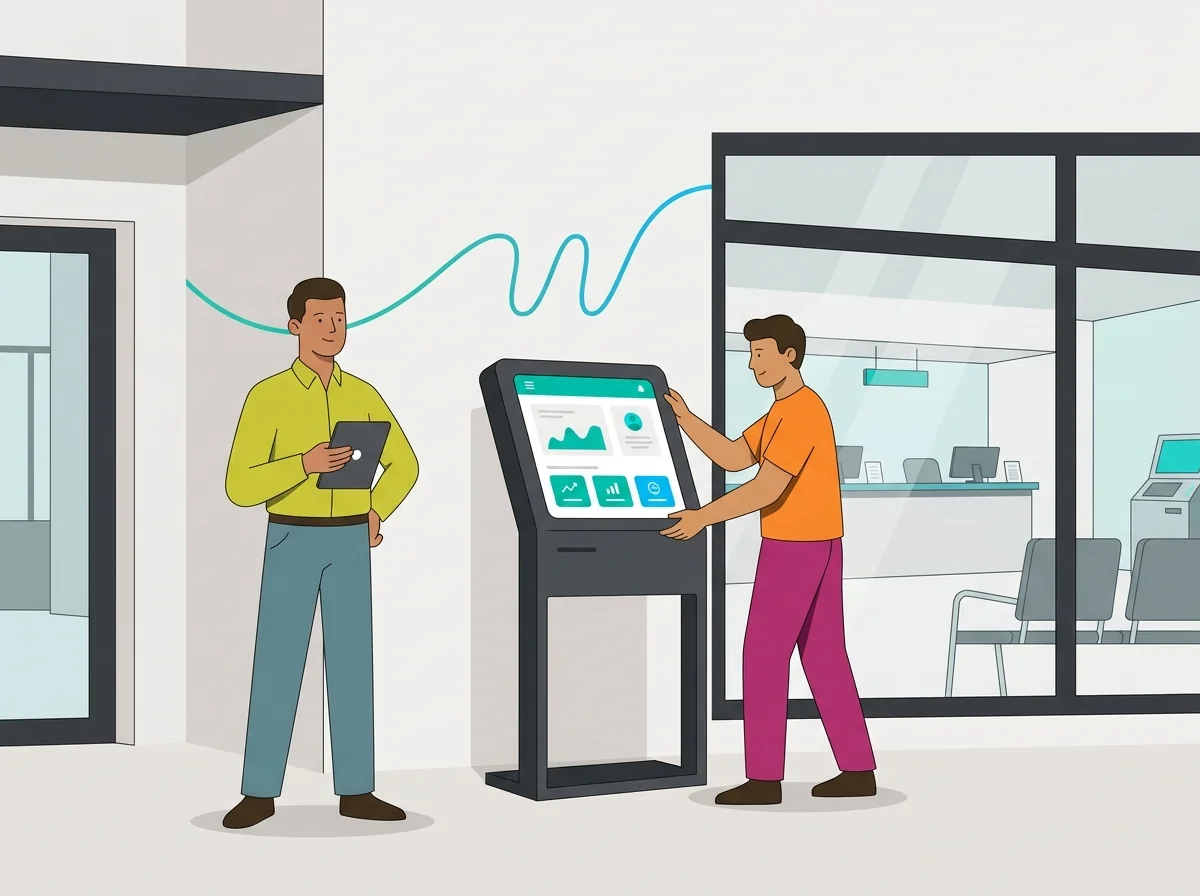
You do not need to overhaul your entire operation to start capturing floor data. The progression typically looks like this:
-
1Start with one branch. Pick your busiest or most problematic location. Install a queue management system there. Run it for 30 days.
-
2Read the data. You will learn more about that branch’s service patterns in one month than you learned in the previous year: peak hours, wait times, walk-out rates, service time by type.
-
3Make one change based on what you see. Shift staffing to match peak hours. Open an additional counter during the morning rush. Assign a slow-moving service to a dedicated window. One data-driven change.
-
4Measure the result. Did wait times drop? Did walk-outs decrease? Did throughput improve? The system tells you.
-
5Expand to other branches. Once you have seen what data-driven operations look like at one location, the case for rolling it out across your network makes itself. Modern systems are built to scale: the data model is the same whether you are running 5 branches or 50, and network-wide performance comparisons become available as each location is added.
In a Nutshell
Without a queue management system, your branches lose the same things every day, across every location, whether you notice it or not:
- ↓Walk-outs go unrecorded. At 5 to 10% daily walk-out rates, thousands of customers per year leave your branches with no trace they were ever there.
- ↓Staffing is based on habit, not demand. You schedule the same way every day because you have no data to tell you Tuesday is 40% busier than Thursday.
- ↓Complaints are your only signal. For every customer who complains, 26 others leave quietly and do not return.
- ↓Branch comparisons are impossible. Without identical metrics, one branch can be outperforming another by 8 minutes on the same service while both managers report things are fine.
- ↓Per-agent performance is invisible. One agent handles 40 customers a day; the next handles 22. Without data, both get the same review.
- ↓Eight data points evaporate per visit. Arrival, wait time, service time, counter, walk-out, transfer, service type, completion: all generated, none captured.
The losses are not dramatic on any given day. They are chronic, invisible, and compounding. The floor is already generating the data. The question is whether you are capturing it.
Waqtak is a cloud-based queue management system built for multi-branch service organizations.
How to Choose the Right Queue Management System
Most organizations approach this decision the wrong way. Features get evaluated before requirements are understood. Price gets compared…

The Benefits of a Queue Management System
A queue management system does two things at once: it organizes your customer flow and generates the data…
Types of Queue Management Systems
There are five main types of queue management systems, each handling customer flow in a different way: Linear…
Want to see how this works in practice?
Book a personalized demo and we will walk you through how Waqtak closes these blind spots for an operation like yours.
Book a Demo